
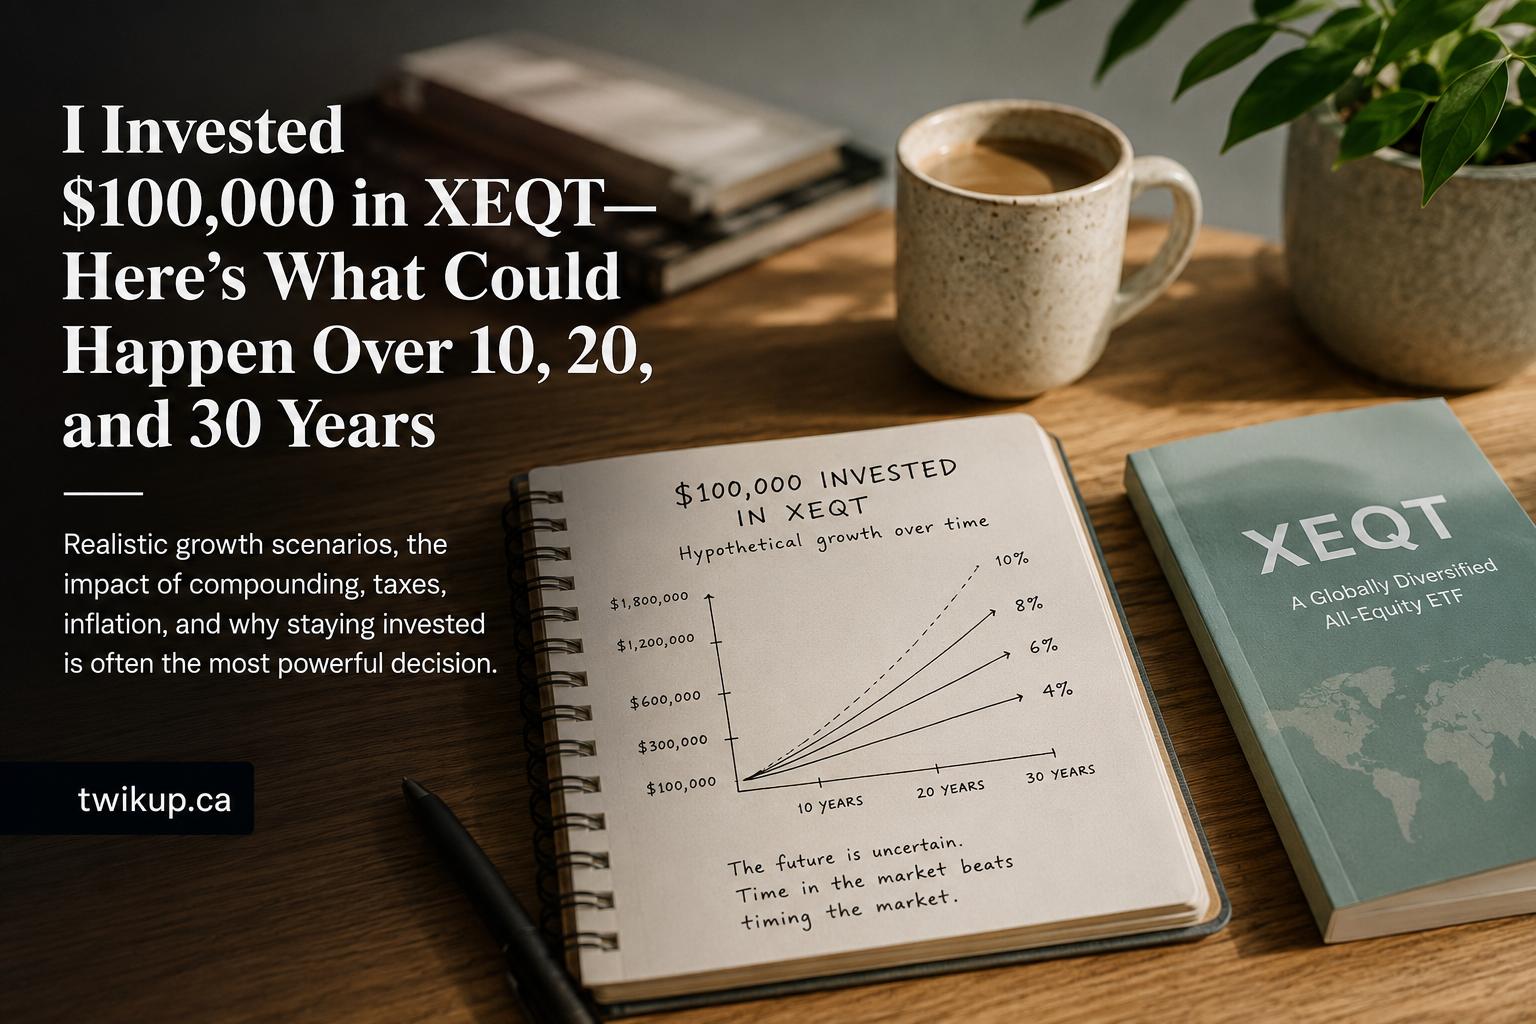
Investing $100,000 in XEQT may feel like a single financial decision, but the outcome will be shaped by decades of market returns, volatility, inflation, taxes, distributions and—most importantly—investor behaviour.
The investment could eventually grow beyond $1 million. It could also fall sharply soon after purchase, remain below its starting value for years or deliver returns that are much lower than an investor expected.
This guide models what could happen to a hypothetical $100,000 XEQT investment under several long-term return scenarios. It does not predict XEQT’s future performance.
Quick Answer
A one-time $100,000 investment in XEQT would hypothetically grow to approximately:
| Assumed annual return | After 10 years | After 20 years | After 30 years |
|---|---|---|---|
| 4% | $148,024 | $219,112 | $324,340 |
| 6% | $179,085 | $320,714 | $574,349 |
| 8% | $215,892 | $466,096 | $1,006,266 |
| 10% | $259,374 | $672,750 | $1,744,940 |
These figures assume:
- no additional contributions;
- no withdrawals;
- all distributions are reinvested;
- returns compound annually;
- no trading commissions or account fees;
- no taxes deducted from the portfolio; and
- the investor remains invested for the entire period.
The actual result could be substantially higher or lower. Markets do not return a smooth percentage every year, and an investor may experience major losses along the way.
TwikUp Insight
The most important number in this experiment may not be XEQT’s return.
It may be the number of years the investor can leave the money untouched.
At an assumed 8% annual return, the hypothetical investment grows by approximately:
- $115,892 during the first 10 years
- $250,203 during the second 10 years
- $540,170 during the third 10 years
The original investment remains $100,000. What changes is the amount of money already compounding.
That is why the final decade can add more wealth than the first two decades combined. However, an investor only reaches that stage by surviving every correction, bear market, recession, frightening headline and temptation to sell that occurs beforehand.
What Exactly Are We Modelling?
This is a hypothetical illustration of what might happen when $100,000 is invested in an all-equity exchange-traded fund such as XEQT.
It is not a backtest, price target or forecast.
A portfolio’s future value can be represented by the compound-growth formula:
Future value = Initial investment × (1 + annual return) ^ number of years
For example, at an assumed annualized return of 8%:
$100,000 × 1.08³⁰ = approximately $1,006,266
That does not mean the investment earns exactly 8% every year.
A real sequence could include:
- a 20% gain in one year;
- a 15% decline the next year;
- several relatively flat years;
- a major bear market;
- a strong recovery; and
- long periods when international, Canadian or US stocks perform differently.
The table simplifies an unpredictable journey into an average annualized outcome.
Scenario 1: A Lower-Return 4% Outcome
If the investment compounds at 4% annually, $100,000 becomes approximately:
| Period | Hypothetical value |
|---|---|
| 5 years | $121,665 |
| 10 years | $148,024 |
| 20 years | $219,112 |
| 30 years | $324,340 |
A 4% outcome would still more than triple the original investment over 30 years.
However, inflation must also be considered. The Bank of Canada targets 2% inflation—the midpoint of a 1% to 3% target range—over the medium term.
If living costs rise over time, $324,340 received three decades from now will not have the same purchasing power that $324,340 has today.
This is the difference between:
- nominal return: the growth visible in the account; and
- real return: the growth remaining after accounting for inflation.
The portfolio could increase in dollars while delivering much less growth in actual purchasing power.
Scenario 2: A 6% Long-Term Outcome
At a hypothetical 6% annual return, the investment grows to:
| Period | Hypothetical value |
|---|---|
| 5 years | $133,823 |
| 10 years | $179,085 |
| 20 years | $320,714 |
| 30 years | $574,349 |
This scenario demonstrates how apparently modest annual differences become substantial over long periods.
After 30 years:
- a 4% return produces approximately $324,340;
- a 6% return produces approximately $574,349.
The difference is roughly $250,000, even though the annual return differs by only two percentage points.
If inflation averaged 2% and the portfolio returned 6%, its approximate inflation-adjusted value after 30 years would be around $317,000 in today’s purchasing power.
That is still significant growth, but it is far below the nominal account value of $574,349.
Scenario 3: An 8% Outcome and the Million-Dollar Threshold
At an assumed 8% annual return:
| Period | Hypothetical value |
|---|---|
| 5 years | $146,933 |
| 10 years | $215,892 |
| 20 years | $466,096 |
| 30 years | $1,006,266 |
Under this simplified scenario, the portfolio crosses $1 million around the 30-year mark.
But the headline can be misleading.
The investor does not turn $100,000 into $1 million by finding a guaranteed 8% investment. No such return is guaranteed.
The result depends on four difficult conditions:
- The portfolio actually achieves an 8% annualized return.
- Distributions remain invested.
- The investor does not withdraw the money.
- The investor does not panic and sell during a severe decline.
The fourth condition is frequently underestimated.
A diversified portfolio can still experience substantial market losses. Diversification can reduce dependence on one company, industry or country, but it cannot eliminate equity-market risk.
Scenario 4: A Strong 10% Outcome
At a hypothetical 10% annual return:
| Period | Hypothetical value |
|---|---|
| 5 years | $161,051 |
| 10 years | $259,374 |
| 20 years | $672,750 |
| 30 years | $1,744,940 |
This is the most optimistic scenario in the comparison.
It shows the mathematical power of high returns sustained over several decades. It should not be treated as a reasonable promise or planning guarantee.
Building a retirement plan around the highest-return scenario can create a dangerous gap between expectations and reality. A more cautious plan may test several possible outcomes rather than relying on one optimistic projection.
What Happens If XEQT Falls Immediately After I Invest?
Suppose the $100,000 portfolio experiences an early decline.
| Market decline | Approximate portfolio value | Gain required to recover |
|---|---|---|
| 10% | $90,000 | 11.1% |
| 20% | $80,000 | 25% |
| 30% | $70,000 | 42.9% |
| 40% | $60,000 | 66.7% |
| 50% | $50,000 | 100% |
Losses and recovery percentages are not symmetrical.
A 50% decline requires a 100% gain merely to return to the starting value.
For someone investing a large lump sum, seeing $100,000 temporarily become $70,000 or $60,000 can feel very different from reading about volatility in theory.
Before investing, the person should ask:
If this investment dropped by $30,000 and remained down for an extended period, would I continue holding it?
If the honest answer is no, the portfolio may be too aggressive for that investor’s risk tolerance, time horizon or financial situation.
The First Year Could Look Nothing Like the 30-Year Projection
Long-term compounding tables are smooth. Markets are not.
After investing $100,000, the first-year result might be:
| First-year market result | Approximate year-end value |
|---|---|
| +25% | $125,000 |
| +10% | $110,000 |
| 0% | $100,000 |
| −10% | $90,000 |
| −25% | $75,000 |
| −40% | $60,000 |
None of these outcomes, by itself, establishes what the investment will be worth after 20 or 30 years.
An early gain does not guarantee continued success. An early loss does not automatically mean the investment strategy has failed.
The appropriate conclusion depends on whether the investor’s financial circumstances, goals, time horizon and capacity for risk have changed.
What Happens If I Withdraw the Distributions?
The growth projections assume that all distributions are reinvested.
If the investor withdraws portfolio distributions for spending, less money remains invested and the final portfolio value will generally be lower.
This does not necessarily make withdrawals wrong. Someone who invested for retirement income may have intended to use the cash.
But investors should distinguish between:
- total return, which includes price changes and distributions; and
- cash received, which is only one component of the investment’s outcome.
A distribution is not automatically free additional wealth. When an investment pays a distribution, the value of the fund reflects that payment.
Focusing only on income can cause an investor to overlook the portfolio’s total return, risk and long-term sustainability.
Investors comparing income-focused and growth-focused strategies can read Dividend ETFs vs. Growth ETFs: Should You Chase High Dividend Yields?.
For strategies that advertise especially high cash yields, see Covered-Call ETFs Explained: Passive-Income Strategy or Performance Trap?.
Does the Account Type Change the Result?
Yes. The same ETF can produce different after-tax outcomes depending on whether it is held in a TFSA, RRSP or non-registered account.
Holding $100,000 in a TFSA
Investment income and gains earned inside a TFSA are generally sheltered from Canadian tax, subject to applicable TFSA rules.
However, an investor cannot assume that having $100,000 in cash means they can contribute the full amount to a TFSA.
The CRA states that the 2026 TFSA annual dollar limit is $7,000. Available room may also include unused room carried forward from previous years and eligible withdrawals added back in a later year.
Contribution room depends on factors including age, Canadian residency history, prior contributions and withdrawals.
The CRA also warns that financial institution records may not be fully reflected immediately in the contribution-room amount displayed in a CRA account. Investors should verify their own records before contributing.
Overcontributing can create tax consequences.
Read The Biggest TFSA Investing Mistake Canadians Make before moving a large amount into a TFSA.
Holding XEQT in an RRSP
An RRSP contribution may produce a tax deduction, depending on the investor’s circumstances and available deduction limit.
Investments can grow within the registered plan, but withdrawals are generally included in taxable income. The eventual after-tax value therefore depends partly on the investor’s tax rate when withdrawing money.
A displayed RRSP balance should not necessarily be treated as fully spendable after-tax wealth.
Holding XEQT in a Non-Registered Account
In a taxable account, investment income and dispositions can create reporting obligations.
The CRA provides separate guidance for investment income such as interest, dividends and capital gains.
An investor may need to track:
- adjusted cost base;
- purchases and reinvested distributions;
- sales or redemptions;
- taxable distributions;
- capital gains or losses; and
- relevant tax slips.
Taxes reduce the amount available to compound or spend. The precise outcome depends on the type of income, the investor’s province, taxable income, transactions and applicable tax rules.
Lump Sum or Gradually Invest the $100,000?
Someone holding $100,000 may feel uncomfortable investing everything on one day.
There are two common approaches.
Lump-sum investing
The entire amount is invested immediately.
Potential advantage:
- all the money begins participating in market gains immediately.
Potential disadvantage:
- the investor could experience a large decline shortly after investing.
Gradual investing
The amount is divided into scheduled investments over several months.
Potential advantage:
- reduces the emotional pressure of selecting one entry date;
- avoids investing the entire amount immediately before a decline.
Potential disadvantage:
- some money remains uninvested while waiting;
- if markets rise during the investment period, later purchases occur at higher prices.
The best behavioural strategy is not always the one with the highest expected mathematical result. It may be the strategy an investor can actually follow without abandoning the plan.
What If I Add $1,000 Per Month?
The original projection assumes no additional contributions.
Regular contributions can dramatically change the outcome.
At a hypothetical 8% annualized return:
- the original $100,000 could grow to roughly $1 million over 30 years;
- additional monthly investments would increase the final amount substantially;
- contributions made early would have more time to compound than contributions made near the end.
However, increasing contributions does not remove market risk. It increases the total amount exposed to both gains and losses.
Investors should not contribute money they may need soon for:
- an emergency fund;
- a home purchase;
- tuition;
- high-interest debt repayment;
- taxes;
- business expenses; or
- other short-term obligations.
Why an Investor Might Still Underperform XEQT
Even if the fund produces a strong long-term return, the person holding it may earn less.
That can happen when the investor:
- buys after a major rally;
- sells during a decline;
- waits in cash for the “perfect” entry;
- repeatedly switches ETFs;
- chases whichever market performed best recently;
- withdraws distributions instead of reinvesting them;
- trades based on forecasts and headlines; or
- abandons the strategy before compounding becomes meaningful.
This is known as an investor-return gap: the investment may perform well over a measured period, while the investor captures less because of contribution, withdrawal and trading decisions.
Read Why Most ETF Investors Underperform Their Own ETFs for a deeper explanation.
Is XEQT Appropriate for Dividend Investors?
An investor does not need to receive a very high distribution yield for a portfolio to build wealth.
Long-term results can come from a combination of:
- distributions;
- earnings growth;
- rising asset values; and
- reinvestment.
Younger investors sometimes focus heavily on dividends because income feels more tangible than unrealized capital growth.
But the most suitable strategy depends on the investor’s complete objectives—not simply the size of a fund’s distribution.
Read Dividend Investing Before Age 30: Smart Strategy or Too Early?.
How Does XEQT Compare With VEQT, VFV and VOO?
These funds should not be treated as interchangeable simply because they all hold stocks.
They can differ in areas such as:
- geographic exposure;
- concentration;
- currency exposure;
- account and tax considerations;
- diversification; and
- dependence on the US market.
A concentrated portfolio may outperform a globally diversified portfolio during a period when its dominant market performs strongly. It may also expose the investor to greater concentration risk.
The right comparison is not:
Which ETF had the highest recent return?
A more useful question is:
Which portfolio exposure can I understand, hold and continue funding across different market environments?
See XEQT vs. VEQT vs. VFV vs. VOO: Which ETF Is Best for Long-Term Investing?.
Five Questions to Answer Before Investing $100,000
1. When will I need the money?
An all-equity investment may be unsuitable for money required in the near future.
A long horizon gives an investor more time to recover from market declines, but recovery is never guaranteed within a particular period.
2. Do I have emergency savings outside the portfolio?
Selling during a downturn to cover an emergency can permanently lock in losses.
3. Can I tolerate a $30,000 or $40,000 temporary decline?
Risk tolerance should be evaluated in dollars, not only percentages.
4. Which account should hold the investment?
TFSA, RRSP and non-registered accounts can produce different contribution, withdrawal and tax consequences.
5. What would cause me to sell?
A written reason for selling can reduce impulsive decisions.
Examples might include:
- reaching a planned financial goal;
- changing to a portfolio suitable for retirement withdrawals;
- a genuine change in risk capacity;
- rebalancing under a predetermined plan; or
- needing funds for their intended purpose.
A scary headline alone is not a complete investment plan.
The Realistic Outcome Is a Range, Not One Number
It is tempting to ask:
What will my $100,000 XEQT investment be worth in 30 years?
No one can provide a reliable exact number.
A more responsible approach is to consider a range:
| 30-year scenario | Hypothetical final value |
|---|---|
| Lower 4% return | $324,340 |
| Moderate 6% return | $574,349 |
| Strong 8% return | $1,006,266 |
| Very strong 10% return | $1,744,940 |
Even this range does not capture every possible outcome.
Returns could be below 4%, above 10% or negative over an investor’s particular holding period. Taxes, fees, inflation, withdrawals and investor behaviour could also materially change the result.
Final Takeaway
A $100,000 XEQT investment could potentially become a much larger portfolio over several decades, but the result will not be determined by a compound-interest calculator alone.
The outcome depends on:
- future global equity returns;
- the sequence of gains and losses;
- inflation;
- account type and taxes;
- reinvestment;
- additional contributions;
- withdrawals;
- investment horizon; and
- the investor’s ability to remain disciplined.
At an assumed 8% return, $100,000 grows to approximately $1 million after 30 years. But the path may include periods when the account appears to be moving in the wrong direction.
The biggest challenge may not be selecting the ETF.
It may be continuing to hold a suitable plan when $100,000 temporarily looks like $70,000—and the financial headlines insist that this time is different.
Disclaimer
This article is provided for general educational and informational purposes only. It does not constitute financial, investment, tax, accounting or legal advice, and it is not a recommendation to buy, sell or hold XEQT or any other security.
All return scenarios are hypothetical illustrations based on constant assumed annual returns. They do not represent actual or guaranteed XEQT performance. Real investment returns fluctuate, may be negative and can differ materially from the examples shown. Past performance does not guarantee future results.
Tax rules and their application depend on individual circumstances and may change. Before making an investment or tax decision, consider consulting an appropriately qualified financial planner, investment professional, accountant or tax adviser.
Government Sources
- Canada Revenue Agency — Calculate your TFSA contribution room
- Canada Revenue Agency — Before you contribute to a TFSA
- Canada Revenue Agency — Contributing to a TFSA
- Canada Revenue Agency — If you over-contribute to a TFSA
- Canada Revenue Agency — Investment income
- Canada Revenue Agency — Tax treatment of mutual funds
- Canada Revenue Agency — Capital Gains Guide
- Bank of Canada — Inflation-control target
- Statistics Canada — Consumer Price Index Portal