
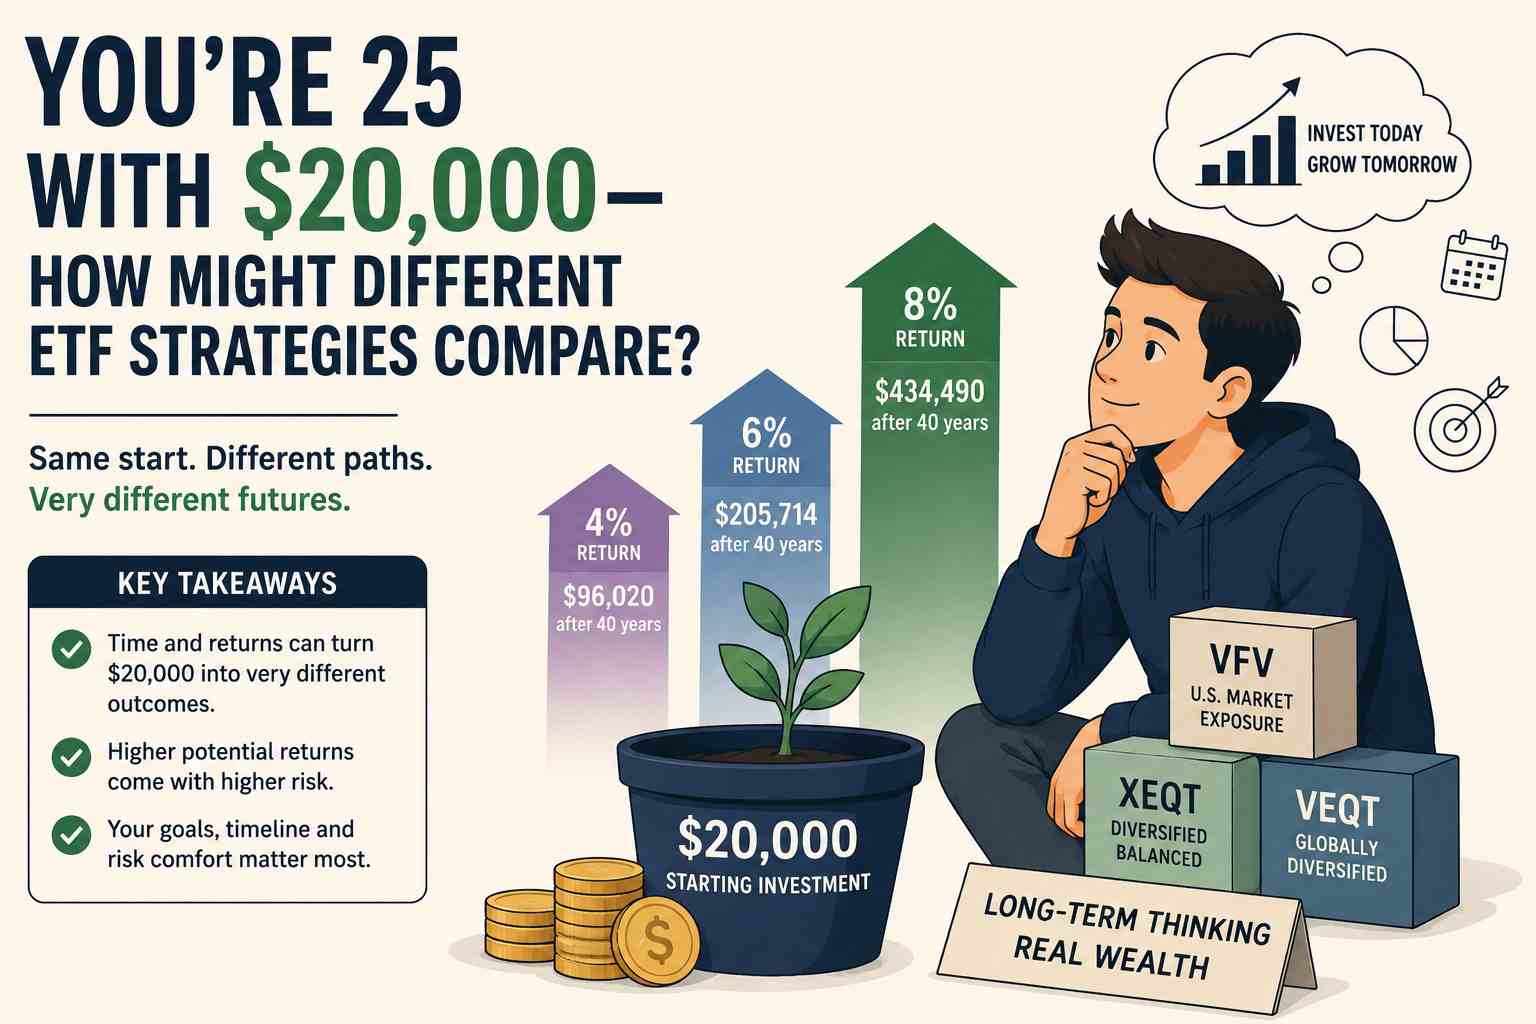
You are 25 years old and have managed to save $20,000.
One person tells you to invest cautiously. Another says you are young enough to accept more market risk. Online calculators show how a relatively modest investment might eventually become hundreds of thousands of dollars.
So, what could happen if the same $20,000 experienced different rates of return over the next 40 years?
The answer depends on three forces: return, risk and time.
For a young Canadian investor, seemingly small differences in annual returns can produce dramatically different outcomes—but higher potential returns usually come with greater uncertainty and larger declines along the way.
The $20,000 Question
Imagine three 25-year-old Canadians.
We will call them Alex, Maya and Ryan.
Each starts with exactly $20,000, reinvests any distributions and makes no additional contributions.
The only difference is the hypothetical annualized return earned by each portfolio:
| Investor | Illustrative Portfolio Profile | Hypothetical Annualized Return |
|---|---|---|
| Alex | Lower-growth profile | 4% |
| Maya | Moderate-growth profile | 6% |
| Ryan | Higher-growth profile | 8% |
These return assumptions are for illustration only. They are not forecasts, recommendations or expected returns for any particular ETF or asset allocation.
Actual ETF returns do not arrive at a constant rate every year. A portfolio may rise substantially one year and decline the next.
For simplicity, the calculations assume a constant annualized return with distributions reinvested. The results are shown before taxes and inflation and do not represent the guaranteed performance of any investment.
What Could $20,000 Become?
Assuming no additional contributions:
| Years Invested | 4% Return | 6% Return | 8% Return |
|---|---|---|---|
| Starting amount | $20,000 | $20,000 | $20,000 |
| 10 years | $29,605 | $35,817 | $43,179 |
| 20 years | $43,822 | $64,143 | $93,219 |
| 30 years | $64,868 | $114,870 | $201,253 |
| 40 years | $96,020 | $205,714 | $434,490 |
After 40 years, the difference between the 4% and 8% scenarios is approximately $338,470.
All three investors started with the same amount. What changed was the rate at which the money compounded.
But investing is more complicated than a compound-growth table.
Scenario 1: A Lower-Growth Portfolio
Alex dislikes seeing investments fall sharply.
He wants exposure to financial markets but prefers a portfolio with more fixed income and less equity exposure than a highly growth-oriented investor might choose.
For this illustration, suppose his long-term annualized return is 4%.
His original $20,000 becomes approximately:
$96,020 after 40 years.
That is considerable growth, but lower-risk portfolios generally sacrifice some potential upside in exchange for reduced exposure to stock-market volatility.
Lower risk does not mean no risk. Bond ETFs can decline when interest rates rise, and conservative portfolios can still lose money.
The Financial Consumer Agency of Canada explains that investments offering higher potential returns generally involve some degree of risk. It also notes that investors with longer-term goals may have more time to recover from losses.
A lower-risk portfolio may make sense for someone who expects to need the money relatively soon or who cannot financially or emotionally tolerate large declines.
At age 25, however, an investor may have several decades ahead. That longer horizon can affect how much short-term volatility the investor is able to accept.
Scenario 2: A Moderate-Growth Portfolio
Maya wants long-term growth but does not want the volatility that may come with the most aggressive possible allocation.
Suppose her diversified portfolio produces a hypothetical 6% annualized return.
Her original $20,000 becomes approximately:
$205,714 after 40 years.
She crosses $200,000 without adding another dollar.
During the first 10 years, her portfolio grows from $20,000 to approximately $35,817—a gain of about $15,817.
Between years 30 and 40, it grows from approximately $114,870 to $205,714. That is roughly $90,845 of additional growth during the final decade alone.
The difference is that later returns are being earned on a much larger investment balance.
This is compounding: previous returns remain invested and can generate returns of their own.
Scenario 3: A Higher-Growth Portfolio
Ryan has a long investment horizon and is comfortable accepting substantially more market volatility.
Suppose his portfolio produces an annualized return of 8% over 40 years.
His original $20,000 becomes approximately:
$434,490.
The investment has grown to more than 21 times its starting value.
That may sound like an obvious winner, but it is not necessarily the right portfolio for every investor.
An 8% annualized return does not mean earning exactly 8% every year. A growth-oriented ETF portfolio can rise strongly during one period and fall sharply during another.
An investor could experience declines of 30% or more during a severe bear market. Depending on the ETF, the decline could be even larger.
If that volatility causes the investor to panic and sell, the hypothetical 40-year result becomes irrelevant. A strategy only works when the investor can realistically remain committed to it through difficult markets.
What the Compound-Growth Table Hides
Compound-growth calculations create smooth, predictable curves.
Markets do not.
Imagine Ryan’s $20,000 grows to $28,000 after several strong years. A major market decline then pushes the account down to $21,000.
On paper, he understands volatility. In practice, he is watching thousands of dollars disappear from his account.
The important question changes from:
“Which return produces the most money after 40 years?”
to:
“Can I experience a major decline without abandoning my plan?”
The Financial Consumer Agency of Canada says risk tolerance depends on both an investor’s emotional willingness to accept risk and their financial ability to absorb a loss.
Someone may have 40 years until retirement but still be unable or unwilling to tolerate a large market decline. Time horizon and emotional risk tolerance are related, but they are not the same thing.
Starting at 25 Gives You Time to Compound
Consider the 8% illustration again.
The original $20,000 grows to approximately:
- $43,179 after 10 years
- $93,219 after 20 years
- $201,253 after 30 years
- $434,490 after 40 years
It takes 20 years for the investment to grow from $20,000 to approximately $93,000.
During the following 20 years, it adds another $341,271.
This happens because the assumed return is being earned on an increasingly large investment balance.
Starting early does not guarantee a successful result, but it gives compounding more time to work. It can also reduce the pressure to chase unusually high returns later.
If contributions continue instead of stopping after the original investment, the results can change substantially. TwikUp’s analysis of how fast a Canadian could potentially build $1 million using ETFs explores different contribution amounts and timelines.
What Inflation Does to the Results
The projected balances above are expressed in future dollars.
Over 40 years, inflation can significantly reduce what those dollars can buy.
For example, if inflation averaged 2% annually, the approximate purchasing power of each ending balance in today’s dollars would be:
| Hypothetical Return | Value After 40 Years | Approximate Value in Today’s Dollars |
|---|---|---|
| 4% | $96,020 | $43,500 |
| 6% | $205,714 | $93,100 |
| 8% | $434,490 | $196,700 |
These inflation-adjusted figures are also illustrations. Actual inflation will vary from year to year.
This does not make long-term investing pointless. It demonstrates why investors should distinguish between nominal growth and growth in purchasing power.
An account balance of $434,490 four decades from now will not necessarily buy what $434,490 buys today.
Fees Can Compound Too
Investment fees may look small when expressed as an annual percentage, but they can have a meaningful effect over several decades.
If two otherwise identical investments earn the same return before fees, the investment with higher ongoing costs will generally leave the investor with less money.
ETF management expense ratios, trading commissions, currency-conversion costs and advisory fees can all affect the final result.
That does not mean the cheapest ETF is automatically the best choice. Portfolio construction, diversification, tax treatment, tracking quality and investor behaviour also matter.
The important point is that return assumptions should clearly indicate whether they are measured before or after fees.
The 4%, 6% and 8% scenarios in this article should be understood as the annualized returns ultimately received by the investor before personal taxes and inflation.
What If You Start With $100,000?
The same mathematics become more dramatic when the starting balance is larger.
A 6% return on:
$20,000 equals $1,200
while the same 6% return on:
$100,000 equals $6,000
during the first year, assuming no fees, taxes or distributions that alter the calculation.
The percentage return is the same, but the dollar gain is much larger because it is being earned on a larger investment base.
TwikUp has also modelled what could happen to $100,000 invested in XEQT over 10, 20 and 30 years.
What If You Do Not Have $20,000?
That may be the more realistic situation.
A 25-year-old might have $2,000 rather than $20,000. Someone may have $20,000 available but need part of it for an emergency fund, education, a vehicle or a future home.
Regular contributions can be at least as important as the starting balance.
Consider someone who invests $500 every month.
That equals:
$6,000 per year.
Over 30 years, the investor contributes $180,000, even before considering investment growth.
When regular contributions are involved, the sequence of market returns can also affect the outcome. Market declines early in the contribution period may allow new contributions to purchase more ETF units, while declines near the end can have a larger effect on an accumulated portfolio.
The eventual result will depend on contributions, market performance, fees, taxes and the timing of returns.
This is why contribution rate and investment duration can matter more than tiny differences between otherwise similar ETFs.
ETFs Are Not Automatically Safe
The word ETF describes an investment structure—not a level of risk or a guarantee of safety.
Different ETFs can hold radically different investments.
One ETF may own thousands of stocks and bonds across global markets. Another may concentrate on one industry, one country, a narrow investment theme or a leveraged strategy.
Their risks can therefore be completely different.
Even a broadly diversified ETF can lose money during a market decline. Diversification can reduce certain risks, but it cannot eliminate the possibility of loss.
TwikUp examined this in ETFs Can Lose Money Too: How $10,000 Fell Below $5,000 in Two Real Funds.
A calculator can show what $20,000 could become under a particular assumption. The market determines the actual result.
Could a TFSA Help?
For eligible Canadians, the type of account holding an ETF can affect the investor’s after-tax result.
A Tax-Free Savings Account can generally hold qualified investments such as cash, bonds, mutual funds and securities listed on designated stock exchanges.
Investment income and capital gains earned inside a TFSA are generally tax-free, including when money is withdrawn.
For 2026, the annual TFSA dollar limit is $7,000. An individual’s available contribution room may be higher because unused room from previous eligible years carries forward.
This does not mean everyone can automatically contribute $20,000.
Available room depends on factors including age, Canadian residency, previous contributions and previous withdrawals. Investors should verify their personal records rather than relying entirely on the balance displayed in their CRA account.
Contributing more than your available TFSA room can generally result in a tax equal to 1% of the excess amount per month while the excess remains.
Changes in the value of investments inside a TFSA do not change contribution room.
If a $20,000 TFSA investment falls to $12,000, the $8,000 decline does not create new contribution room. Likewise, investment gains do not use additional room.
Withdrawals are treated differently: amounts withdrawn from a TFSA are generally added back to contribution room at the beginning of the following calendar year, not immediately.
Which Return Scenario Wins?
If the comparison is based only on the hypothetical ending values, the 8% scenario finishes with the largest amount:
| Hypothetical Annualized Return | $20,000 After 40 Years |
|---|---|
| 4% | $96,020 |
| 6% | $205,714 |
| 8% | $434,490 |
But investing cannot be judged solely by the largest projected balance.
A portfolio also has to survive real life.
Before investing, consider:
- how soon you may need the money
- whether you have high-interest debt
- whether you have adequate emergency savings
- how much volatility you can financially absorb
- how much volatility you can emotionally tolerate
- whether the portfolio is properly diversified
- the investment’s fees and tax treatment
- whether you can remain invested during a major market decline
The highest theoretical return is not useful if the associated risk causes you to sell at the worst possible time.
TwikUp Insight
The most powerful part of investing $20,000 at age 25 may not be the $20,000.
It may be the 40 years potentially sitting in front of it.
In these hypothetical scenarios, the difference between earning 4% and 8% annually is not a few thousand dollars. It is approximately $338,470 after 40 years.
That does not mean investors should chase the highest possible return.
The larger lesson is that returns, fees, inflation, diversification, contribution habits and time can create enormous differences when their effects compound for decades.
Young investors often assume their greatest advantage is the ability to find the next winning investment.
Their greater advantage may be having enough time to let a diversified, affordable and sustainable strategy work.
Important Note
This article is for educational and informational purposes only. It does not constitute financial, investment, tax or legal advice.
The 4%, 6% and 8% returns are hypothetical scenarios designed to illustrate compounding. They are not forecasts, recommendations or expected returns for any ETF or asset allocation.
Actual investments can rise or fall substantially. Past performance does not guarantee future results. Consider your financial situation, objectives, time horizon and tolerance for risk before making an investment decision.
Sources
- how fast a Canadian could potentially build $1 million using ETFs
- what could happen to $100,000 invested in XEQT over 10, 20 and 30 years
- ETFs Can Lose Money Too: How $10,000 Fell Below $5,000 in Two Real Funds
- Government of Canada — Financial Consumer Agency of Canada: Setting savings and investment goals
- Canada Revenue Agency — Tax-Free Savings Account
- Canada Revenue Agency — Before you contribute to a TFSA
- Canada Revenue Agency — Calculate your TFSA contribution room