
Key Takeaways
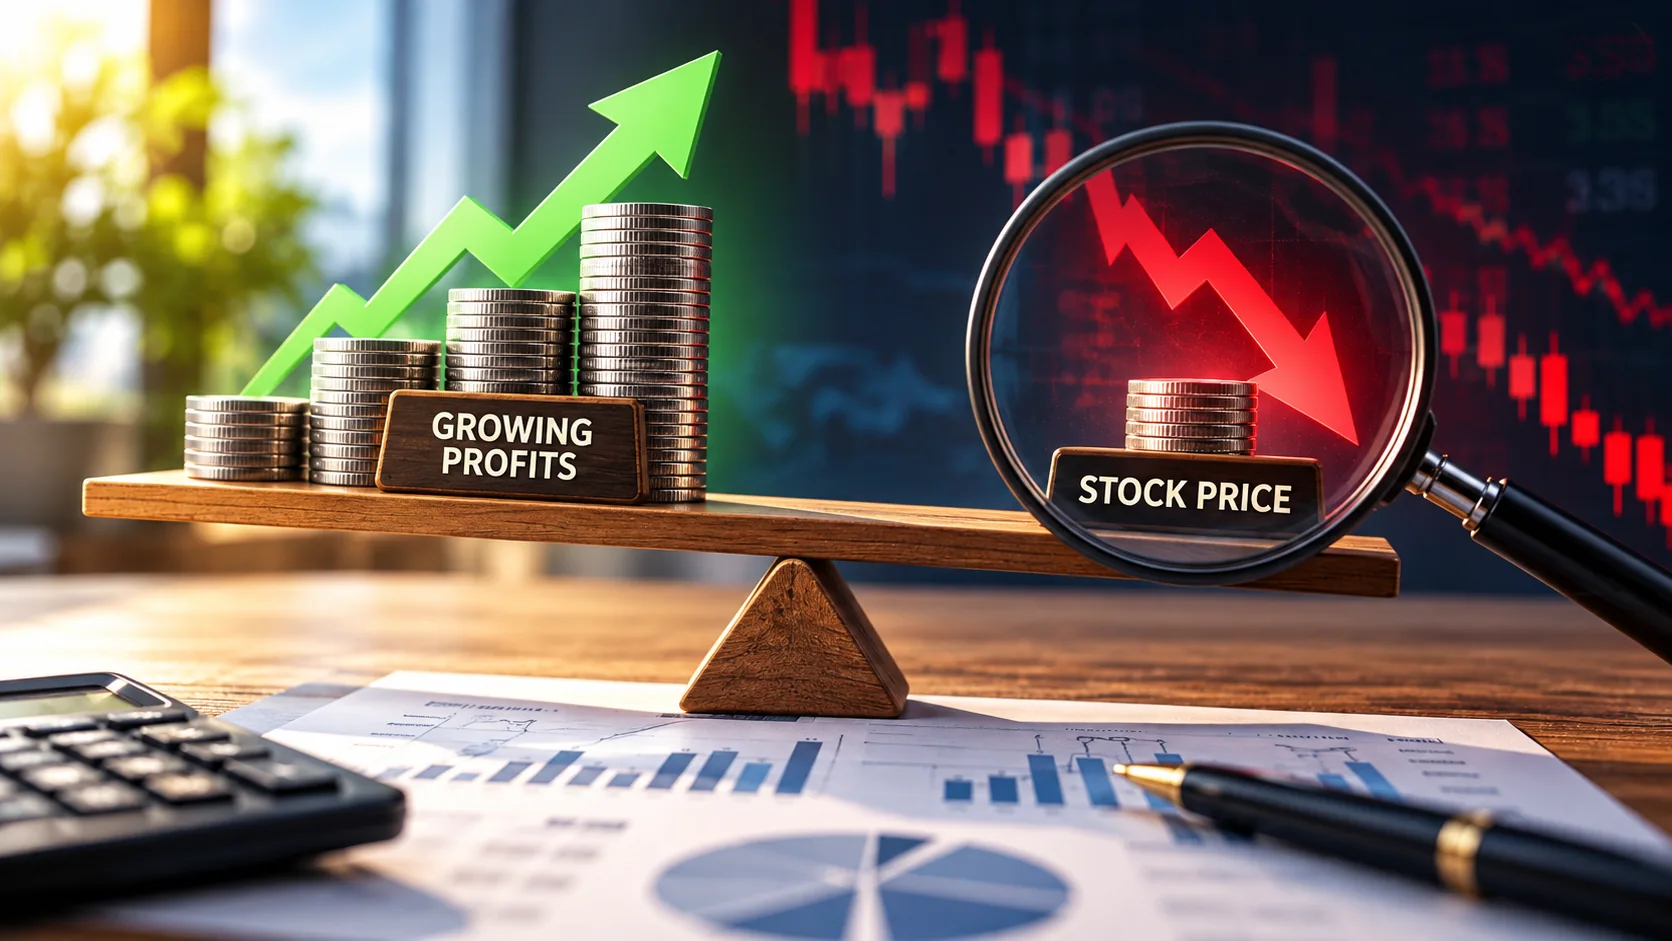
- A company can grow revenue and earnings while shareholders lose money if its valuation multiple declines.
- The PEG ratio relies on earnings-growth forecasts, so it can become misleading when expectations are revised lower.
- Investors should assess sustainable growth, cash flow, competition and the price already reflected in a stock.
What If the Biggest Risk Isn't the Company, but the Price You Pay?
Imagine investing $10,000 in a company that everyone believes will become the next big winner.
Its sales are exploding. Profits are climbing. Customers are pouring in. Financial experts are talking about its extraordinary future.
You finally buy the stock, convinced you've made a smart decision.
Then something terrifying happens.
Your $10,000 investment falls to $4,000.
You've lost $6,000. Yet the company hasn't gone bankrupt. Its customers haven't disappeared. Its products are still selling, and the business continues making money.
How can a company succeed while its investors lose 60% of their money?
That $6,000 loss is a hypothetical example, but the danger behind it is real. And one of the pandemic's biggest business success stories provides a remarkable lesson.
Zoom Was Growing Like Crazy. So What Went Wrong?
In 2020, the world suddenly needed a way to work, study and communicate without leaving home.
Zoom was perfectly positioned.
Offices moved online. Classrooms became video calls. Families used the platform to stay connected.
The company's financial results were extraordinary.
According to its official filings with the U.S. Securities and Exchange Commission (SEC), Zoom's annual revenue jumped from approximately $623 million in fiscal 2020 to $2.65 billion in fiscal 2021.
That's 326% growth in just one year.
Its operating income surged from roughly $12.7 million to $659.8 million.
For a while, it seemed almost impossible to imagine the company slowing down.
But here's where the story gets interesting.
Zoom didn't need to collapse for investors to become disappointed. Its growth simply needed to stop being extraordinary.
| Fiscal year | Annual revenue | Revenue growth |
|---|---|---|
| 2020 | $623 million | — |
| 2021 | $2.65 billion | 326% |
| 2022 | $4.10 billion | 55% |
| 2023 | $4.39 billion | 7% |
Zoom was still generating billions in annual revenue. But the pace of expansion had changed dramatically.
Think about that.
A business can grow 7% and still be financially successful. But a stock priced on expectations of explosive growth may struggle when investors realize that the extraordinary years won't last forever.
The problem isn't necessarily the company.
Sometimes, it's what investors were willing to pay for it.
The Hidden Danger of Paying for Tomorrow's Success
Suppose two companies each earn $5 per share annually.
One grows slowly. The other is expected to increase earnings rapidly for years.
Naturally, investors might pay a higher price for the faster-growing company.
That's where the price-to-earnings ratio, or P/E, becomes useful.
If a stock costs $100 and earns $5 per share, its P/E ratio is 20. Investors are paying $20 for every $1 of annual earnings.
But a P/E ratio alone doesn't explain how much future growth might justify that price.
Enter the PEG ratio.
The price/earnings-to-growth ratio divides a company's P/E ratio by its expected annual earnings growth rate, expressed as a percentage number.
Consider two hypothetical businesses.
| Company A | Company B | |
|---|---|---|
| P/E ratio | 30 | 30 |
| Expected annual earnings growth | 30% | 10% |
| PEG ratio | 1.0 | 3.0 |
Company A appears more attractively priced relative to its expected earnings growth.
A PEG ratio around 1 is sometimes used as a rough benchmark, but it doesn't automatically mean a stock is fairly valued.
Here's the catch.
The entire calculation depends on a prediction about the future.
What if Company A's expected earnings growth drops from 30% to 10%?
Its PEG ratio jumps from 1 to 3 if the P/E ratio remains unchanged.
Suddenly, the same stock looks considerably more expensive relative to its growth prospects.
Nothing magical happened to the business overnight. The forecast changed.
And when investors lose confidence in future growth, the price they're willing to pay can fall sharply.
The Company Doubles Its Profits. You Make Almost Nothing.
Now imagine something even more frustrating.
You invest $10,000 in a company earning $2 per share.
Because investors expect rapid growth, its stock trades at 50 times earnings, making each share worth $100.
Over the next five years, the company performs remarkably well.
Its earnings grow 15% annually, more than doubling to approximately $4.02 per share.
You were right about the business.
But there's a problem.
Investors are no longer willing to pay 50 times earnings. They're willing to pay only 25 times.
Here's what happens.
| When you buy | Five years later | |
|---|---|---|
| Earnings per share | $2.00 | $4.02 |
| P/E ratio | 50 | 25 |
| Share price | $100 | $100.57 |
| Your investment | $10,000 | $10,057 |
Illustrative example assuming 15% annual earnings growth, no dividends, no share dilution and fractional shares.
Five years of waiting.
The company's earnings more than doubled.
Your $10,000 investment earned approximately $57.
That's a total return of just 0.57% over five years, before inflation, fees and taxes.
You didn't choose a failing business. You correctly anticipated strong earnings growth.
What went wrong was the price you paid at the beginning.
This is known as valuation multiple compression. Even impressive earnings growth can be offset when investors become unwilling to pay the same premium for those earnings.
And if the P/E ratio had fallen further, you could have lost money despite the company's success.
Five Questions That Could Save You From an Expensive Mistake
Before buying a fast-growing stock, looking at its PEG ratio is only the beginning.
1. Can the growth realistically continue?
A company doubling revenue from $10 million to $20 million faces a very different challenge from one trying to double revenue from $10 billion to $20 billion. Growth often becomes harder as businesses mature.
2. Is the company actually generating cash?
Reported profits don't always translate into cash available to the business. Free cash flow can reveal whether the company is generating money after capital spending.
3. What if growth is only half as strong as expected?
If analysts predict 30% annual earnings growth, examine what the valuation would look like at 15%. A promising investment shouldn't depend entirely on a perfect forecast.
4. How much success is already included in the share price?
A fantastic business can still be overpriced. Compare its valuation with realistic future earnings, competitors and its own historical multiples.
5. What prevents competitors from taking its customers?
Customer loyalty, pricing power, technological advantages and strong operations can help protect profits. Without lasting advantages, exceptional growth may be difficult to sustain.
None of these checks eliminates investment risk. Together, however, they provide a more complete picture than a single valuation ratio.
TwikUp's Perspective: The Right Company at the Wrong Price
Zoom's financial history illustrates how quickly extraordinary revenue growth can return to more ordinary levels. Its SEC filings establish that business trajectory; the hypothetical investment examples above demonstrate the separate risk of paying too much for expected earnings.
The PEG ratio is useful, but it cannot tell you whether a growth forecast will come true, whether competition will intensify or whether investors will continue paying a premium.
A stronger valuation approach combines realistic earnings expectations, cash flow, financial strength, competitive advantages and the possibility that valuation multiples will decline.
Before investing, ask yourself two questions.
Will this company become more successful?
And how much of that future success am I already paying for today?
Because sometimes the biggest investing mistake isn't choosing the wrong company.
It's choosing the right company at the wrong price.
The SEC links lead to Zoom's official filing history. All investment scenarios are illustrative, not documented individual investor experiences.
Sources
- U.S. SEC — Zoom Video Communications, Fiscal 2021 Annual Report (Form 10-K)
- U.S. SEC — Zoom Video Communications, Fiscal 2022 Annual Report (Form 10-K)
- U.S. SEC — Zoom Video Communications, Fiscal 2023 Financial Results in SEC-Filed Proxy Statement
- U.S. SEC — Zoom Video Communications, Fiscal 2024 Annual Report (Form 10-K)