
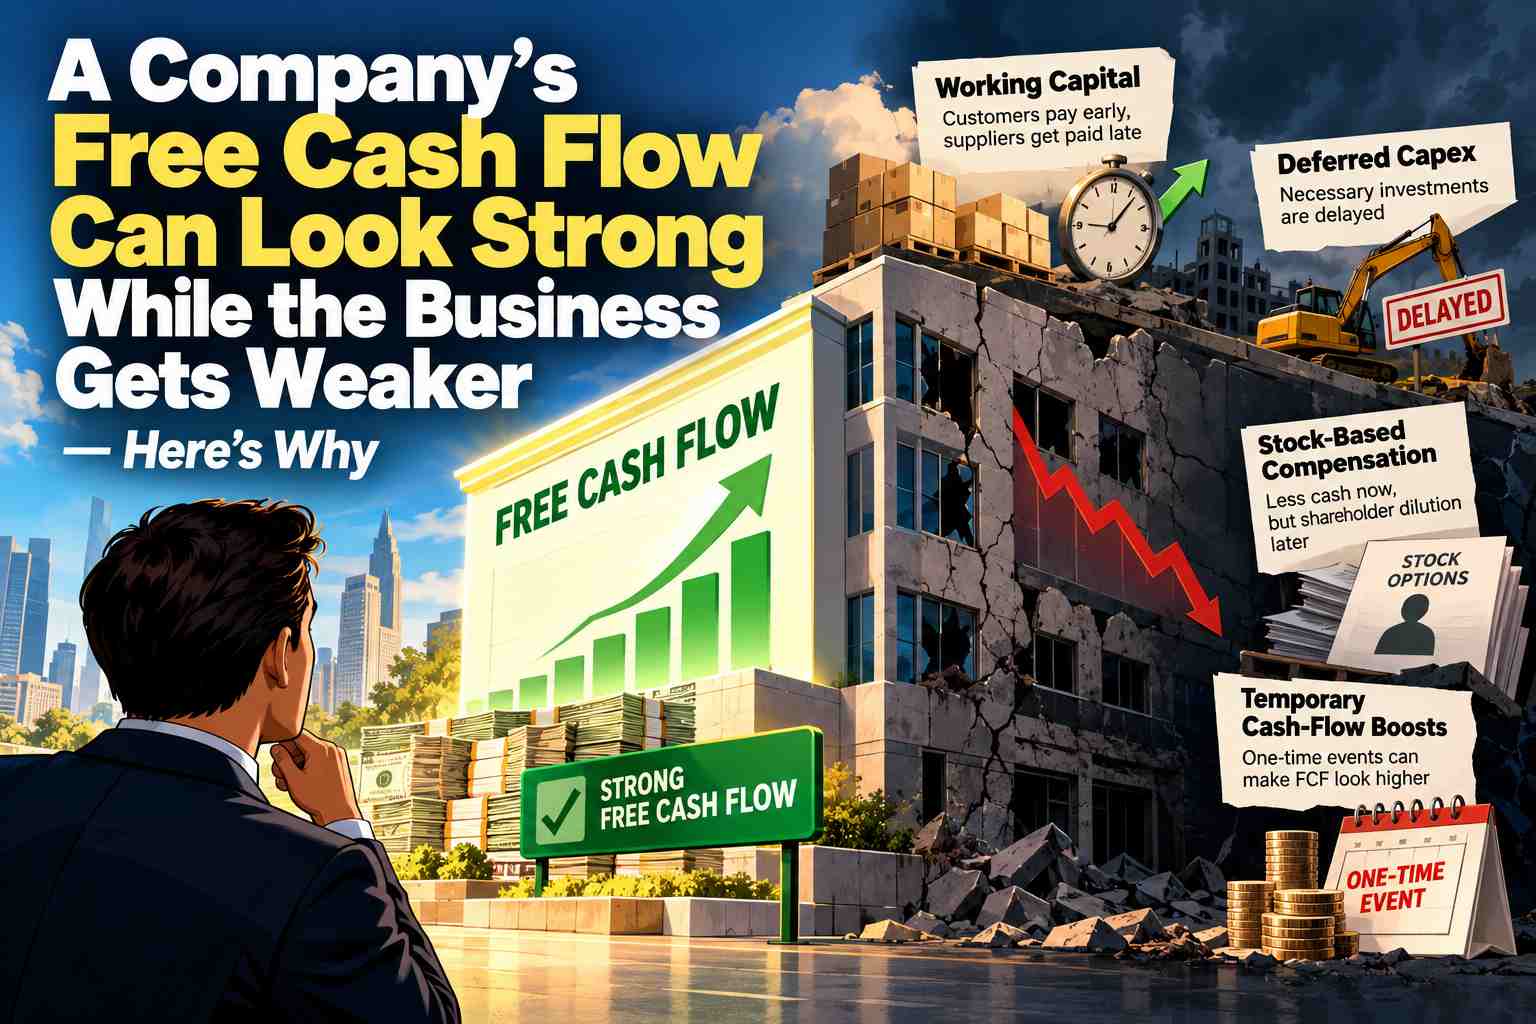
Key Takeaways
- Strong free cash flow can be inflated by working-capital timing, including faster collections, lower inventory or delayed supplier payments.
- Lower capital expenditures can raise FCF today while postponing the investment needed to maintain a business’s competitive position.
- Assess FCF across several years, including revenue, margins, capex, stock-based compensation and diluted share count.
A Company’s Free Cash Flow Can Look Strong While the Business Gets Weaker — Here’s Why
Imagine two companies.
Company A generates $500 million in free cash flow.
Company B generates only $300 million.
At first glance, Company A looks like the obvious winner. It appears to be producing substantially more cash that could potentially be used to reduce debt, invest in growth, buy back shares or strengthen the balance sheet.
But then you look underneath the headline number.
Company A delayed replacing aging equipment. Customers paid unusually early before year-end. The company stretched payments to suppliers. Employees received more stock-based compensation instead of cash compensation.
Suddenly, that impressive $500 million deserves a second look.
This is the free cash flow trap.
Free cash flow can be one of the most useful numbers in financial analysis, but investors can get into trouble when they treat one year of strong FCF as automatic evidence of a strong business.
The more important question is:
Where did the cash actually come from — and can the company generate it again?
First, What Is Free Cash Flow?
A commonly used version of free cash flow is:
Free Cash Flow = Operating Cash Flow − Capital Expenditures
Suppose a company generates $800 million from operating activities and spends $300 million on capital expenditures.
Its free cash flow would be approximately:
$800 million − $300 million = $500 million
That calculation is simple.
Interpreting the result is not.
Free cash flow is generally a non-GAAP measure, and there is no single universal definition used by every company. Investors therefore need to check exactly how management calculates the number rather than assuming two companies reporting "FCF" are measuring precisely the same thing.
More importantly, both sides of the basic FCF equation can temporarily move in ways that make the final number look unusually attractive.
That is where deeper analysis begins.
Trap #1: Working Capital Can Temporarily Inflate Cash Flow
One of the easiest places to misunderstand cash generation is working capital.
Consider three important accounts:
- accounts receivable
- inventory
- accounts payable
Suppose a company normally allows customers 60 days to pay but suddenly becomes aggressive about collecting invoices before year-end.
Cash arrives faster.
Operating cash flow rises.
Free cash flow may rise with it.
But the company hasn't necessarily become more profitable or structurally better.
It may simply have collected cash earlier.
The opposite can happen with suppliers.
Imagine the company normally pays suppliers after 30 days but begins paying them after 60 days.
Cash remains in the company's bank account longer.
Again, operating cash flow can improve.
But those bills haven't disappeared.
They have merely moved into the future.
A Simple Example
Imagine operating cash flow rises from $400 million to $600 million.
That sounds fantastic.
Then you discover:
- accounts receivable contributed an extra $70 million
- inventory reductions released $50 million
- accounts payable added another $80 million
Together, those working-capital movements contributed $200 million.
The business may still be healthy. But the apparent jump from $400 million to $600 million looks very different once you understand where the additional cash came from.
Working capital is real cash.
The key issue is repeatability.
A company cannot endlessly reduce inventory, accelerate customer collections or postpone supplier payments without eventually reaching practical limits.
Trap #2: Cutting Capital Expenditure Can Make FCF Look Better
This is one of the most important traps because it sits directly inside the most common free-cash-flow calculation.
Remember:
FCF = Operating Cash Flow − Capital Expenditures
Now imagine a manufacturing company generates $700 million in operating cash flow.
Last year it spent $300 million on factories, machinery, technology and equipment.
FCF:
$700M − $300M = $400M
This year management cuts capital expenditure to $150 million.
Assume operating cash flow remains exactly $700 million.
FCF suddenly becomes:
$700M − $150M = $550M
Free cash flow increased 37.5%.
Did the underlying business improve by 37.5%?
Not necessarily.
Maybe management became more efficient and genuinely needed less investment.
But perhaps the company simply postponed replacing machinery, delayed opening facilities or pushed technology upgrades into next year.
That creates an important distinction between lower capex because the business needs less capital and lower capex because necessary spending has been deferred.
Both can produce higher FCF today.
Their long-term implications can be completely different.
The Maintenance Capex Problem
This leads investors to a harder question:
How much capital expenditure is required merely to keep the existing business competitive?
Imagine a delivery company owns thousands of trucks.
It could reduce vehicle purchases dramatically this year and produce excellent free cash flow.
For a while.
But trucks age.
Maintenance costs increase. Reliability can deteriorate. Eventually the fleet needs replacement.
The same principle can apply to factories, hotels, telecom networks, data centres, retail stores and other capital-intensive businesses.
A company can sometimes make today's cash flow look stronger by borrowing investment from tomorrow.
That doesn't automatically mean management is doing anything improper. Capital spending naturally moves between periods.
But investors should ask whether unusually low capex is sustainable.
Trap #3: Stock-Based Compensation Can Make Cash Flow Look Better Than the Economic Cost Suggests
Stock-based compensation creates another subtle issue.
Suppose a technology company pays an employee:
$150,000 cash salary
Another company provides:
$100,000 cash salary + $50,000 in stock-based compensation
From an immediate cash perspective, the second structure requires less cash.
That can help operating cash flow.
But the $50,000 didn't become economically free.
Existing shareholders may bear the cost through dilution if additional shares are issued or through company cash if management later repurchases shares to offset dilution.
This is why investors should be careful when a fast-growing company celebrates strong free cash flow while simultaneously issuing substantial amounts of stock to employees.
FCF may correctly describe the cash generated during the period.
But it does not necessarily capture the entire economic cost borne by shareholders.
The Question Investors Should Ask
Instead of asking only:
"How much free cash flow did the company generate?"
also ask:
"How much stock-based compensation was required to generate it?"
Then examine what is happening to the diluted share count.
If FCF rises 20% while diluted shares outstanding rise substantially as well, the improvement experienced by each individual shareholder may be less impressive than the headline growth rate suggests.
Trap #4: Temporary Events Can Produce Beautiful Cash Flow
Sometimes strong FCF isn't caused by manipulation, deteriorating economics or aggressive accounting.
It is simply temporary.
A company might receive:
- unusually large customer prepayments
- annual subscription payments upfront
- tax refunds
- insurance proceeds
- favourable timing of supplier payments
- temporary inventory reductions
- other one-time or timing-related cash benefits
All of these can affect cash flow.
Suppose a business normally generates around $300 million in annual free cash flow.
This year it reports $470 million.
That looks like extraordinary growth.
But imagine $120 million came from customers paying unusually early and another $50 million came from a temporary inventory reduction.
The $470 million is still real cash generated during the period.
The mistake would be automatically assuming that $470 million is the company's new normal.
For investors valuing businesses based on future cash generation, that distinction matters enormously.
Strong FCF Isn't the Problem — Blindly Trusting It Is
None of this means investors should ignore free cash flow.
Quite the opposite.
FCF can help investors understand whether reported profits are translating into cash and how much financial flexibility a business may have after capital expenditures.
The mistake is treating FCF as a standalone score.
A better approach is to examine several years together.
Imagine a company reports:
| Year | Free Cash Flow |
|---|---|
| Year 1 | $310M |
| Year 2 | $325M |
| Year 3 | $340M |
| Year 4 | $590M |
Instead of immediately celebrating Year 4, investigate what changed.
Did revenue surge?
Did margins improve?
Did operating cash flow grow because the core business became stronger?
Or did capex collapse?
Did accounts payable jump?
Did inventory fall dramatically?
Did customers prepay?
Did stock-based compensation increase?
The bridge between $340 million and $590 million can sometimes tell you more than the $590 million itself.
The 7-Question Free Cash Flow Test
Before concluding that a company's rising FCF represents genuine improvement, investors can run through seven questions.
1. Is revenue growing?
Sustained cash-flow growth is generally more convincing when the underlying business is also expanding.
2. What happened to operating margins?
If revenue and operating economics are weakening while FCF is exploding higher, investigate the discrepancy.
3. How much came from working capital?
Look at receivables, inventory and payables rather than stopping at operating cash flow.
4. Did capital expenditure suddenly fall?
Determine whether lower spending reflects efficiency or delayed investment.
5. How large is stock-based compensation?
Compare SBC with operating cash flow and FCF, especially for businesses where equity compensation is significant.
6. Is the diluted share count rising?
Strong company-wide cash generation becomes less attractive to an individual shareholder if their ownership is being materially diluted over time.
7. Can today's FCF reasonably repeat?
This may be the most important question of all.
Valuations depend on future cash flows, not simply the most flattering number from the latest twelve months.
TwikUp Analysis: Follow the Source of the Cash
Investors often search for the perfect financial metric.
Net income has weaknesses, so they move to EBITDA.
EBITDA has weaknesses, so they move to operating cash flow.
Then they discover free cash flow and assume they have finally reached a number that cannot mislead them.
Financial analysis rarely works that way.
Every metric answers a particular question.
Free cash flow can tell you something extremely valuable about cash generation after certain capital expenditures. It cannot, by itself, tell you whether today's cash generation is sustainable, whether investment has been postponed, whether working-capital benefits will reverse or whether shareholders are absorbing a meaningful cost through dilution.
That is why the better investing habit isn't simply:
"Find companies with high free cash flow."
It is:
"Find companies with high-quality, repeatable free cash flow — and understand exactly where that cash came from."
A boring $400 million generated consistently from a healthy core business can ultimately tell you more than a spectacular $600 million created partly by temporary working-capital movements and unusually low investment.
The headline number gets your attention.
The cash-flow statement tells you the story.
For another layer of financial-statement analysis, read TwikUp's guide to Are a Company's Profits Real? 5 Numbers Every Investor Should Check.
Founders and startup investors can also read Startup Term Sheets Explained: The Investment Agreement Every Founder Must Understand.
This article is for educational purposes only and should not be considered investment advice.