
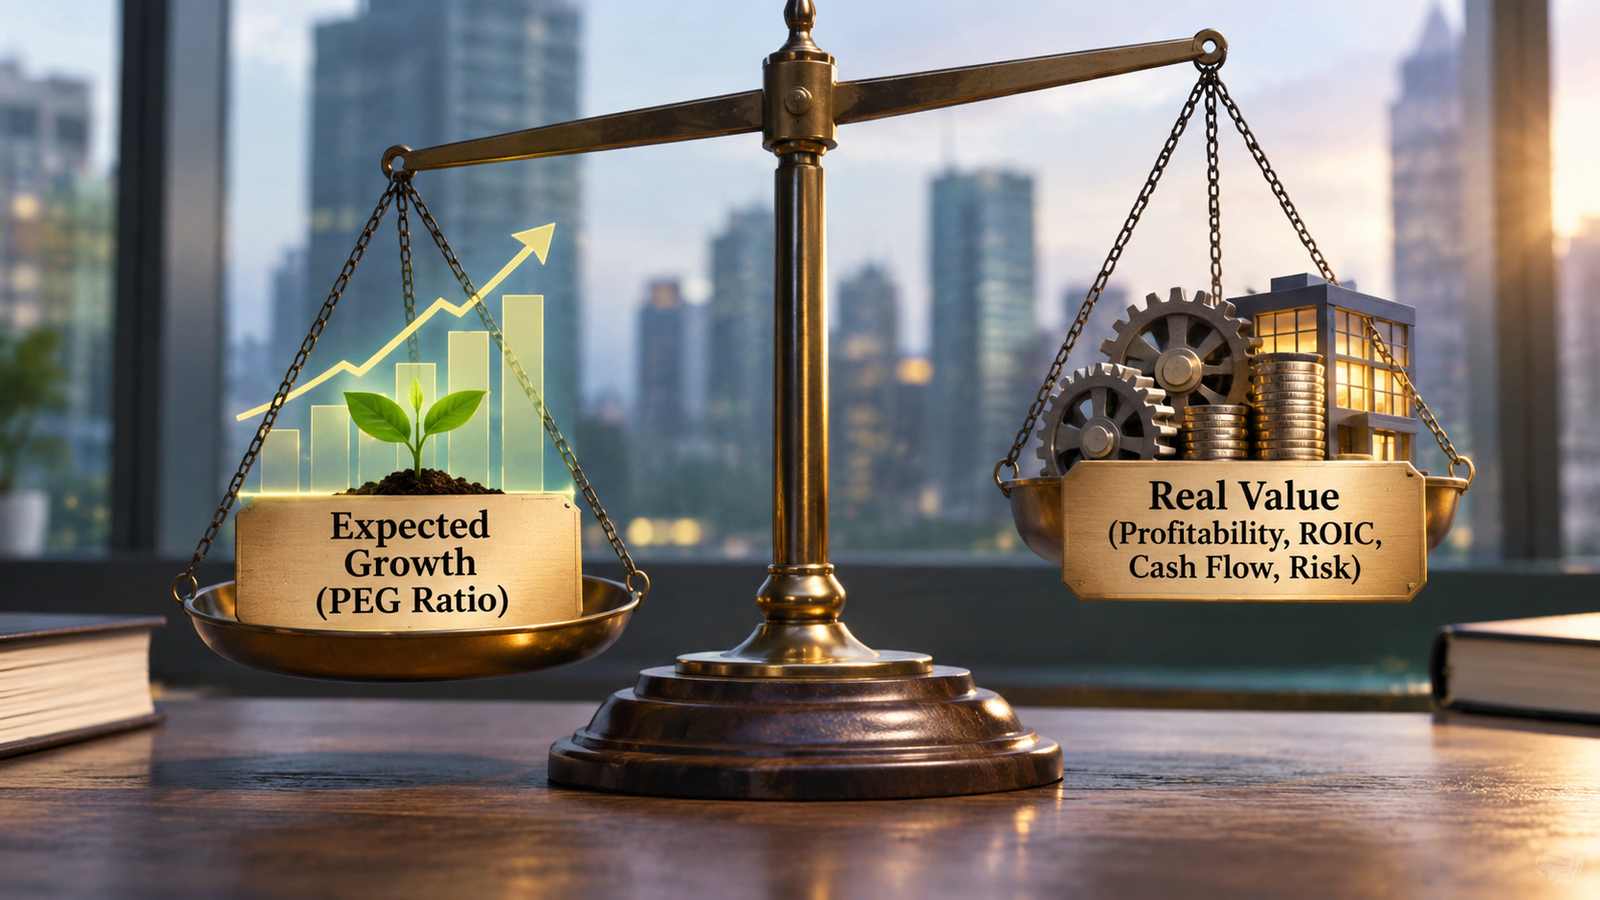
Key Takeaways
- The PEG ratio adjusts the P/E multiple for expected earnings growth, but it depends heavily on the growth estimate used.
- Two companies with identical PEG ratios can have very different earnings quality, reinvestment needs, capital efficiency and business risks.
- Investors should combine valuation multiples with cash flow analysis, ROIC, sustainable growth assumptions and business risk.
Why Is the PEG Ratio Not Enough to Value Growth Stocks?
A company reports 30% annual earnings growth and trades at 30 times earnings. Its PEG ratio is 1. Another company grows earnings by 10% and trades at 10 times earnings. Its PEG ratio is also 1.
Do these businesses deserve the same valuation?
Not necessarily.
The PEG ratio is a useful starting point because it compares a company's price-to-earnings multiple with its expected earnings growth. But it does not tell investors whether that growth is sustainable, profitable, financially healthy or worth the risks involved.
A fast-growing company may need heavy investment, borrow more money or issue additional shares to support expansion. Another company may grow more slowly while producing stronger free cash flow and higher returns on invested capital.
Both could display the same PEG ratio, yet their underlying economics may be completely different.
The better approach is to treat PEG as one screening tool and examine the quality, durability and cost of future growth before deciding what a stock is worth.
What Is the PEG Ratio and How Is It Calculated?
The price-to-earnings-to-growth ratio, commonly called PEG, adjusts a company's P/E ratio for its earnings growth rate.
The standard formula is:
PEG Ratio = P/E Ratio ÷ Annual EPS Growth Rate
For example, imagine a company trades at a P/E ratio of 30 and analysts expect annual earnings per share growth of 20%.
PEG = 30 ÷ 20 = 1.5
A PEG of 1.5 means the P/E multiple is 1.5 times the growth rate expressed as a percentage number.
Some investors use a PEG near 1 as a rough valuation reference. A lower figure may suggest that investors are paying less for each unit of expected growth. However, 1 is not a universal fair-value threshold. Interest rates, business risk, profitability, industry economics and the duration of growth all influence what investors should be willing to pay.
It is also important to use consistent inputs. A forward P/E should generally be compared with an appropriate forward growth estimate, while a historical calculation should clearly identify the historical period used.
Why Can Two Stocks With the Same PEG Have Different Values?
Consider two hypothetical companies:
| Financial Measure | Company A | Company B |
|---|---|---|
| P/E ratio | 30 | 30 |
| Expected EPS growth | 20% | 20% |
| PEG ratio | 1.5 | 1.5 |
| Free cash flow | Strong | Weak |
| Debt burden | Moderate | High |
| Reinvestment needs | Manageable | Heavy |
| Earnings quality | Consistent | Volatile |
Their PEG ratios are identical, but their financial positions are not.
Company A converts a meaningful portion of its earnings into cash and does not require excessive investment to maintain expansion. Company B reports similar expected earnings growth but needs substantial capital spending and borrowing to pursue it.
The second company may face greater financial pressure if demand slows or financing becomes expensive.
The PEG ratio does not capture these differences. It focuses on the relationship between valuation and earnings growth, not the full economics behind that growth.
Is the Expected Earnings Growth Rate Reliable?
This is one of the biggest weaknesses of PEG.
The calculation is only as reliable as the earnings growth estimate entered into it. Forward estimates are forecasts, not guaranteed outcomes. Analysts may revise them when demand, costs, competition or economic conditions change.
Consider a hypothetical stock trading at a P/E of 30.
- At expected growth of 30%, its PEG is 1.
- At expected growth of 20%, its PEG becomes 1.5.
- At expected growth of 10%, its PEG becomes 3.
The share price and P/E have not changed. Only the growth assumption has changed, yet the valuation signal looks very different.
Investors should ask what is driving the forecast. Is growth supported by customer demand, pricing power and new products, or does it depend on optimistic assumptions about future market share?
Also examine whether the forecast starts from an unusually weak earnings year. A temporary recovery can produce impressive percentage growth without representing a durable long-term expansion.
Why Should Investors Examine ROIC Alongside PEG?
Growth creates value only when the returns generated by additional investment justify the capital required to achieve it.
Return on invested capital, or ROIC, helps investors evaluate how efficiently a business uses its invested capital to generate operating profit.
A simplified formula is:
ROIC = Net Operating Profit After Tax ÷ Average Invested Capital × 100
Imagine two businesses both expected to grow earnings by 20%.
The first company can expand using existing infrastructure and earns attractive returns on additional investment. The second must spend heavily on new facilities and earns much lower returns on the extra capital.
The same earnings growth rate does not necessarily mean the same value creation.
Investors should therefore examine whether growth is supported by strong capital efficiency, not just whether the forecast looks impressive.
Our guide, ROIC vs ROE: The Metric That Can Reveal a Better Business Before the Stock Price Does, explains why return on capital can reveal important differences between businesses that headline earnings figures may miss.
Does the PEG Ratio Ignore Cash Flow and Reinvestment?
Yes. The traditional PEG ratio does not directly measure free cash flow, capital expenditure, working capital requirements or the amount of money a company must reinvest to maintain growth.
That omission matters because accounting earnings and cash generation are not identical.
A business may report rising EPS while spending heavily on equipment, technology, inventory or customer acquisition. If cash generation remains weak, the company may need additional borrowing or equity issuance to fund its expansion.
A useful investor checklist includes:
- Operating cash flow compared with net income.
- Capital expenditure and future investment requirements.
- Free cash flow trends.
- Working capital changes.
- Stock-based compensation and share-count growth.
- Debt levels and interest obligations.
Investors should also examine whether earnings growth is translating into growth in diluted EPS. If a company issues shares regularly, total net income may rise faster than the earnings attributable to each share.
How Can Investors Build a Better Growth Stock Valuation Framework?
Instead of relying on one ratio, investors can assess a growth stock through five connected questions.
1. Is the growth sustainable?
Examine customer demand, recurring revenue, pricing power, competitive advantages and the size of the company's addressable market. Avoid assuming that an exceptional growth rate will continue indefinitely.
2. Is growth profitable?
Compare revenue growth with operating margins, net income and free cash flow. Rapid expansion that repeatedly weakens margins deserves closer attention.
3. Does the business earn attractive returns on capital?
Review ROIC and determine whether new investment is generating sufficient operating returns.
4. How risky are the growth assumptions?
Consider competition, customer concentration, debt, economic sensitivity and the possibility that forecasts will be revised downward.
5. Does the current price leave room for disappointment?
Compare the current valuation with reasonable growth scenarios. A company can execute well and still deliver disappointing investment returns if its shares already reflect overly optimistic expectations.
For another perspective on valuation, read Is a Low P/E Stock Really Cheap? 7 Things Investors Must Check Before Buying. It explains why earnings quality, debt and business fundamentals matter when judging whether a stock is genuinely attractive.
TwikUp's Perspective
The PEG ratio is appealing because it turns a complicated question into one simple number. But simplicity can become a problem when investors mistake a screening metric for a complete valuation method.
A low PEG does not automatically mean a bargain, just as a high PEG does not automatically mean an overpriced business. The real issue is what investors are receiving for the price they pay.
Sustainable earnings growth, strong cash conversion, disciplined reinvestment and attractive returns on capital can make growth more valuable. Weak financial quality and unrealistic forecasts can make even an apparently cheap growth stock expensive.
Investors should use PEG to identify companies worth investigating, then examine the business behind the number. Valuation becomes more meaningful when growth, profitability, risk and reinvestment are considered together.
Disclaimer
This article is intended for educational and informational purposes only and does not constitute financial, investment or personalised investment advice. All company figures and comparisons are hypothetical. Earnings forecasts are uncertain and valuation ratios depend on the assumptions and reporting periods used. Investors should review official financial statements, assess relevant risks and conduct independent research before making investment decisions. TwikUp does not guarantee investment returns or recommend buying or selling any particular security.