
Quick Answer
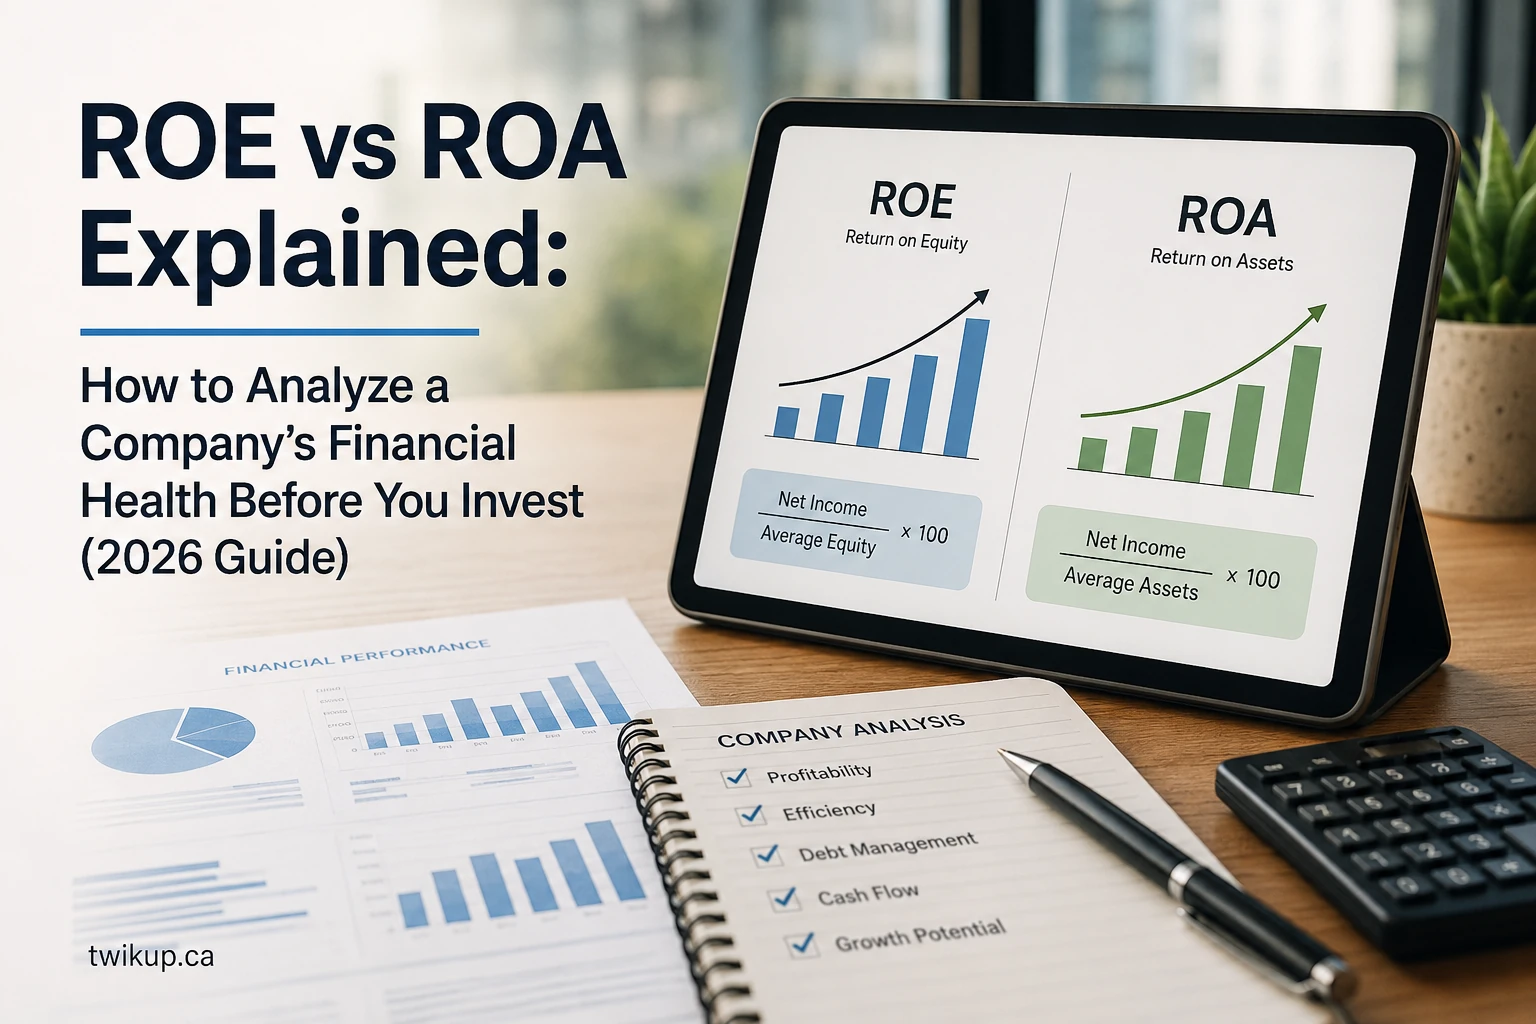
Return on equity (ROE) measures how effectively a company generates profit from shareholders’ money, while return on assets (ROA) measures how efficiently it generates profit from everything it owns or controls.
The basic formulas are:
- ROE = Net income ÷ Average shareholders’ equity × 100
- ROA = Net income ÷ Average total assets × 100
A high ROE may indicate a profitable, well-managed business—but it can also be inflated by debt, share buybacks or unusually low shareholder equity. ROA provides an additional reality check because it considers the company’s entire asset base, including assets financed with borrowed money.
For most investors, the strongest signal is not simply a high ROE or ROA. It is a company that produces:
- Consistently healthy ROE
- Stable or improving ROA
- Manageable debt
- Positive cash flow
- Sustainable profit growth
- Returns that compare favourably with similar companies
ROE and ROA should therefore be analyzed together rather than used as independent buy-or-sell signals.
TwikUp Insight
A company can appear extremely efficient when judged by ROE alone—even while becoming financially riskier.
Imagine two companies earning the same $10 million annual profit. One has $100 million of shareholder equity, while the other has only $25 million because it relies heavily on debt.
The first company has an ROE of 10%. The second reports an ROE of 40%.
At first glance, the second company looks far superior. But its higher ROE may be driven primarily by financial leverage rather than a stronger underlying business.
That is why investors should ask three questions whenever they see an unusually high ROE:
- Is net income genuinely growing?
- Is shareholder equity shrinking?
- Is debt increasing faster than profit?
The quality of the return matters more than the headline percentage.
What Is Return on Equity?
Return on equity measures how much net profit a company generates relative to the capital attributable to its shareholders.
Shareholders’ equity is generally calculated as:
Shareholders’ equity = Total assets − Total liabilities
It represents the accounting value remaining for shareholders after the company’s liabilities are deducted from its assets.
ROE helps answer an important question:
For every dollar of shareholder equity invested in the company, how much annual profit is the business producing?
ROE Formula
ROE = Net income ÷ Average shareholders’ equity × 100
Average equity is normally more informative than year-end equity because a balance sheet represents only one point in time.
Average shareholders’ equity =
(Beginning shareholders’ equity + Ending shareholders’ equity) ÷ 2
ROE Example
Assume a company reports:
- Net income: $15 million
- Beginning shareholders’ equity: $90 million
- Ending shareholders’ equity: $110 million
First, calculate average equity:
($90 million + $110 million) ÷ 2 = $100 million
Then calculate ROE:
$15 million ÷ $100 million × 100 = 15%
The company generated approximately 15 cents of annual net profit for every dollar of average shareholder equity.
What Is Return on Assets?
Return on assets measures how much profit a company produces relative to its total asset base.
A company’s assets may include:
- Cash
- Inventory
- Buildings
- Machinery
- Equipment
- Accounts receivable
- Investments
- Intellectual property
- Goodwill and other intangible assets
ROA helps investors evaluate whether management is using these resources efficiently.
ROA Formula
ROA = Net income ÷ Average total assets × 100
Average total assets can be calculated as:
Average total assets =
(Beginning total assets + Ending total assets) ÷ 2
Some financial databases and analysts may use slightly different versions of ROA, including calculations that adjust net income for interest expense. Investors should confirm the methodology before comparing figures obtained from different sources.
ROA Example
Assume the same company reports:
- Net income: $15 million
- Beginning total assets: $280 million
- Ending total assets: $320 million
Average assets would be:
($280 million + $320 million) ÷ 2 = $300 million
ROA would be:
$15 million ÷ $300 million × 100 = 5%
The business generated approximately five cents of annual profit for every dollar of average assets.
ROE vs ROA: What Is the Difference?
| Measurement | ROE | ROA |
|---|---|---|
| Full name | Return on equity | Return on assets |
| Main purpose | Measures returns generated from shareholder equity | Measures profit generated from total assets |
| Basic formula | Net income ÷ Average equity | Net income ÷ Average assets |
| Includes effect of debt | Indirectly—and can be heavily influenced by it | Yes, because assets include those financed by debt and equity |
| Best used for | Evaluating shareholder-capital efficiency | Evaluating overall asset efficiency |
| Major weakness | Can be inflated by leverage or low equity | Can appear low in asset-heavy industries |
| Primary question | How effectively is shareholder capital being used? | How effectively is the total asset base being used? |
The two ratios examine the same company from different perspectives.
ROE focuses on the shareholders’ portion of the capital structure. ROA examines the productivity of the broader asset base, regardless of whether those assets were financed through debt or equity.
Why Is ROE Usually Higher Than ROA?
ROE is commonly higher because shareholder equity is generally smaller than total assets.
Consider a company with:
- Total assets: $500 million
- Total liabilities: $350 million
- Shareholders’ equity: $150 million
- Net income: $30 million
Its ROA is:
$30 million ÷ $500 million × 100 = 6%
Its ROE is:
$30 million ÷ $150 million × 100 = 20%
Both ratios use the same net income, but ROE uses a smaller denominator.
The gap between ROE and ROA can also reveal how significantly debt is affecting shareholder returns. A very wide gap may indicate substantial financial leverage.
How Debt Can Increase ROE
Debt allows a company to control more assets without issuing additional shareholder equity.
When borrowed money produces returns greater than its financing cost, leverage can benefit shareholders. Net income rises while the equity base remains relatively small, potentially producing a higher ROE.
However, leverage works in both directions.
When revenue or profit declines, the company must generally continue paying:
- Interest
- Principal repayments
- Lease obligations
- Other fixed financing costs
A leveraged company may therefore produce impressive shareholder returns during favourable conditions but suffer sharper declines when business conditions deteriorate.
Example: Same Profit, Different Capital Structures
| Company | Net Income | Assets | Equity | Liabilities | ROA | ROE |
|---|---|---|---|---|---|---|
| Company A | $10 million | $100 million | $80 million | $20 million | 10% | 12.5% |
| Company B | $10 million | $100 million | $25 million | $75 million | 10% | 40% |
Both companies generate the same profit from the same amount of assets, so both have a 10% ROA.
Company B reports a much higher ROE only because its shareholder-equity base is considerably smaller.
The table does not automatically prove that Company B is a poor investment. It shows why ROE must be examined alongside debt, interest expenses, cash flow and balance-sheet strength.
What Is a Good ROE?
There is no universal ROE percentage that makes a company financially healthy.
A good ROE depends on:
- Industry
- Business model
- Debt level
- Economic conditions
- Company maturity
- Accounting structure
- Profit stability
- Capital requirements
An asset-light software company may produce a substantially higher ROE than a utility, manufacturer or telecommunications company that requires expensive infrastructure.
A better approach is to compare a company’s ROE with:
- Its historical ROE
- Direct competitors
- The median for its industry
- Its debt and interest burden
- Its earnings and cash-flow growth
A stable 16% ROE supported by low debt and growing cash flow may be more attractive than a volatile 35% ROE created by aggressive borrowing.
What Is a Good ROA?
ROA also varies significantly by industry.
Asset-heavy businesses commonly report lower ROA because they require large investments in physical infrastructure.
Examples may include:
- Airlines
- Railways
- Utilities
- Telecommunications companies
- Manufacturers
- Energy producers
- Real estate businesses
Asset-light companies may require fewer physical assets to generate revenue and can therefore report higher ROA.
Examples may include:
- Software businesses
- Consulting firms
- Online marketplaces
- Certain financial-service companies
- Digital subscription businesses
Investors should not assume that a low ROA automatically indicates poor management. The number becomes meaningful when compared with businesses that operate under similar economic conditions.
Innovation, Science and Economic Development Canada provides industry-level financial performance data that can help business owners and investors understand how financial ratios differ across Canadian industries.
How to Analyze ROE and ROA Together
The following combinations can provide useful clues.
| ROE | ROA | Possible Interpretation |
|---|---|---|
| High | High | Potentially efficient and profitable business |
| High | Low | Returns may be amplified by leverage or a small equity base |
| Low | High | Company may have a conservative capital structure or unusually large equity base |
| Low | Low | Weak profitability, inefficient asset use or temporary business pressure |
| Rising | Rising | Improving profitability and capital efficiency |
| Rising | Falling | ROE may be receiving help from debt, buybacks or shrinking equity |
| Falling | Rising | Asset efficiency may be improving while equity expands faster than earnings |
| Falling | Falling | Potential deterioration requiring further investigation |
These interpretations are starting points, not conclusions. The financial statements and management commentary must explain what is driving the change.
The DuPont Analysis: Understanding What Drives ROE
The DuPont framework separates ROE into three components:
ROE =
Net profit margin
× Asset turnover
× Equity multiplier
The components can be written as:
Net profit margin = Net income ÷ Revenue
Asset turnover = Revenue ÷ Average total assets
Equity multiplier = Average total assets ÷ Average shareholders’ equity
This breakdown helps investors identify whether ROE is being driven by:
- Strong profit margins
- Efficient asset utilization
- Financial leverage
DuPont Example
Assume a company reports:
- Net profit margin: 10%
- Asset turnover: 1.2
- Equity multiplier: 2
Its estimated ROE would be:
10% × 1.2 × 2 = 24%
Now assume its equity multiplier rises from 2 to 3 while its margins and asset turnover remain unchanged:
10% × 1.2 × 3 = 36%
ROE rises from 24% to 36%, but the company has not improved its profit margin or asset productivity. The increase results entirely from leverage.
This is why the DuPont method is valuable: it shows the source of a company’s apparent financial strength.
How Share Buybacks Can Affect ROE
When a company repurchases its shares, treasury stock and cash can reduce reported shareholders’ equity.
If net income remains stable while equity declines, ROE rises mathematically.
For example:
| Period | Net Income | Average Equity | ROE |
|---|---|---|---|
| Before buyback | $20 million | $200 million | 10% |
| After buyback | $20 million | $125 million | 16% |
The company’s earnings did not improve, yet ROE increased from 10% to 16%.
Buybacks can create value when shares are repurchased below their intrinsic value and the company retains adequate financial flexibility. However, an improving ROE caused mainly by a shrinking equity base should not be confused with stronger operating performance.
Negative Equity Can Make ROE Misleading
ROE becomes difficult—or economically meaningless—to interpret when shareholders’ equity is negative.
Negative equity can arise from:
- Accumulated losses
- Heavy debt
- Large share repurchases
- Asset write-downs
- Certain accounting adjustments
- Years of dividend payments exceeding retained earnings
Suppose a company has:
- Net income: $8 million
- Shareholders’ equity: negative $20 million
A conventional ROE calculation would produce a negative percentage, but that result does not communicate the company’s profitability in a useful way.
When equity is negative or extremely small, investors should focus more heavily on:
- ROA
- Operating margin
- Free cash flow
- Debt-to-equity alternatives
- Net debt
- Interest coverage
- Debt maturity schedule
- Return on invested capital
One-Time Gains Can Distort Both Ratios
ROE and ROA use net income, which may include gains or losses unrelated to normal operations.
Examples include:
- Sale of property
- Sale of a business division
- Legal settlements
- Tax benefits
- Insurance recoveries
- Restructuring expenses
- Asset impairments
- Foreign-exchange gains or losses
A company could report a temporary jump in ROE and ROA after selling a building, even though revenue and operating profit declined.
Investors should compare reported net income with adjusted earnings and cash flow—but they should also review how management defines its adjustments.
Not every expense labelled “one-time” is truly unusual. Companies that repeatedly exclude restructuring, acquisition or stock-compensation costs may be presenting a more favourable picture of recurring profitability.
Where to Find the Numbers
The figures required to calculate ROE and ROA can normally be found in a company’s:
- Annual report
- Quarterly report
- Income statement
- Balance sheet
- Notes to the financial statements
- Management discussion and analysis
Net income appears on the income statement.
Total assets and shareholders’ equity appear on the balance sheet.
The U.S. Securities and Exchange Commission’s guide to financial statements explains that the balance sheet provides detailed information about a company’s assets, liabilities and shareholders’ equity, while the income statement shows revenue, expenses and earnings over a reporting period.
For Canadian public companies, investors can generally review regulatory filings through the company’s investor-relations page and Canada’s securities-filing system.
Why Average Assets and Equity Are Better
Net income accumulates over a period, such as a quarter or full year. Assets and equity are measured at a particular date.
Using only year-end assets or equity can distort the comparison, particularly when a company completed a major acquisition, issued shares, repurchased stock or sold assets during the year.
Consider a company whose equity increased from $100 million to $200 million after issuing shares near the end of the year.
Using ending equity would produce:
$20 million net income ÷ $200 million = 10% ROE
Using average equity would produce:
Average equity = ($100 million + $200 million) ÷ 2
Average equity = $150 million
$20 million ÷ $150 million = 13.3% ROE
Neither method perfectly reflects the timing of every transaction, but average balance-sheet values generally provide a more representative denominator.
Can ROE and ROA Be Used for Banks?
ROE and ROA are widely followed when analyzing banks, but the interpretation differs from that of an industrial company.
Banks use deposits and other liabilities as part of their core business model. Their asset bases are large relative to equity, so even a seemingly small ROA can contribute to a meaningful ROE.
When analyzing a bank, investors should also consider:
- Capital ratios
- Net interest margin
- Loan-loss provisions
- Credit quality
- Efficiency ratio
- Deposit stability
- Non-performing loans
- Regulatory capital requirements
Comparing a bank’s ROA with a software company’s ROA would not provide a useful conclusion. Industry context remains essential.
Can ROE and ROA Be Used for Startups?
These ratios are usually less useful for early-stage startups that are not yet profitable.
A young company may deliberately spend heavily on:
- Product development
- Hiring
- Marketing
- Customer acquisition
- Technology infrastructure
- Geographic expansion
Negative net income produces negative ROE and ROA, but the percentages alone do not explain whether the company is building a valuable business or consuming capital without progress.
For early-stage businesses, investors may place greater emphasis on:
- Revenue growth
- Gross margin
- Customer retention
- Recurring revenue
- Cash-burn rate
- Runway
- Customer-acquisition cost
- Lifetime customer value
- Path to profitability
Readers examining private-company economics may also find TwikUp’s guide to the complete startup fundraising roadmap from idea to IPO useful for understanding how funding rounds affect ownership, capital and company growth.
ROE and ROA vs EBITDA
ROE and ROA measure returns after accounting for most expenses included in net income.
EBITDA examines earnings before interest, taxes, depreciation and amortization. It is commonly used to evaluate operating performance and compare companies with different financing or depreciation structures.
However, EBITDA does not directly measure the return earned on shareholder equity or total assets.
A company may report growing EBITDA while producing weak ROA because it requires substantial capital investment to maintain or expand its operations.
Similarly, a highly leveraged company may report strong EBITDA but weak net income after interest expenses.
For a deeper explanation, read EBITDA Explained: What It Means, Formula, Examples, and Why Investors Use It.
ROE and ROA Do Not Tell You Whether a Stock Is Cheap
A profitable company is not automatically an attractive investment at any price.
ROE and ROA help investors evaluate business quality and capital efficiency. They do not measure valuation.
A company can have excellent returns but trade at a price that assumes years of near-perfect growth.
Investors may also examine:
- Price-to-earnings ratio
- Price-to-book ratio
- Enterprise value to EBITDA
- Free-cash-flow yield
- Earnings growth
- Revenue growth
- Dividend sustainability
- Expected future returns
Business quality and investment value are connected, but they are not identical.
This distinction also matters when comparing individual stocks with diversified funds. Investors who prefer broad market exposure can review TwikUp’s comparison of XEQT, VEQT, VFV and VOO for long-term investing.
A Practical Company-Analysis Example
Consider two fictional retailers.
Financial Information
| Metric | Northern Retail | Maple Retail |
|---|---|---|
| Revenue | $1 billion | $1 billion |
| Net income | $80 million | $80 million |
| Average assets | $800 million | $800 million |
| Average equity | $400 million | $160 million |
| Average liabilities | $400 million | $640 million |
Step 1: Calculate ROA
Both companies produce the same profit from the same asset base:
$80 million ÷ $800 million × 100 = 10%
Both have a 10% ROA.
Step 2: Calculate ROE
Northern Retail:
$80 million ÷ $400 million × 100 = 20%
Maple Retail:
$80 million ÷ $160 million × 100 = 50%
Maple Retail’s ROE looks much stronger.
Step 3: Examine the Balance Sheet
Maple Retail has $640 million of liabilities, compared with Northern Retail’s $400 million.
The two companies have identical revenue, profit, assets and ROA. Maple Retail’s higher ROE is therefore primarily the result of its smaller equity base and greater leverage.
Step 4: Investigate the Risk
An investor should now compare:
- Interest expenses
- Debt maturity dates
- Fixed versus variable-rate borrowing
- Interest-coverage ratios
- Free cash flow
- Lease obligations
- Revenue stability
- Economic sensitivity
If Maple Retail has stable cash flow and low-cost, long-term debt, its leverage may be manageable. If its sales are volatile and its debt matures soon, the 50% ROE may reflect substantially greater risk.
A Seven-Step ROE and ROA Checklist
1. Calculate Both Ratios
Do not rely on ROE alone. Calculate ROA using the same reporting period and methodology.
2. Use Average Balance-Sheet Values
Use average assets and average equity when the required figures are available.
3. Compare at Least Five Years
One year can be distorted by acquisitions, asset sales, recessions, tax changes or unusual gains.
4. Compare Similar Companies
Compare a retailer with retailers, a bank with banks and a software company with software companies.
5. Examine the Gap Between ROE and ROA
A widening gap may indicate increasing leverage or a shrinking equity base.
6. Check Cash Flow and Debt
Confirm that reported profits are turning into cash and that financing obligations remain manageable.
7. Study What Changed
Determine whether improving returns came from:
- Higher revenue
- Better margins
- Improved asset turnover
- Debt-funded expansion
- Share repurchases
- Asset disposals
- Accounting adjustments
The direction of a ratio is useful. The reason for the change is more useful.
Common Mistakes Investors Make
Treating a High ROE as an Automatic Buy Signal
A high ROE can result from strong operations, but it can also result from excessive leverage or unusually low equity.
Comparing Different Industries
ROE and ROA ranges vary greatly across sectors because business models and capital requirements differ.
Using Only One Year
A temporary gain or economic rebound can make one year look unusually strong.
Ignoring Negative or Tiny Equity
ROE can become distorted when the denominator is extremely small or negative.
Overlooking Share Buybacks
Repurchases can reduce equity and lift ROE without improving profit.
Ignoring Cash Flow
Accounting earnings do not always translate into cash available to shareholders.
Assuming Higher Is Always Better
Extremely high returns can signal a durable competitive advantage, but they can also signal financial leverage, accounting distortions or an unsustainable peak in profitability.
Warning Signs to Investigate
An investor should look more closely when:
- ROE rises while ROA falls
- Debt grows faster than revenue
- Equity declines year after year
- Cash flow consistently trails net income
- ROE changes dramatically without comparable profit growth
- Management repeatedly highlights adjusted profit but avoids reported earnings
- Asset impairments occur frequently
- Interest coverage deteriorates
- A company’s returns are far above all competitors without a clear business explanation
- The company has negative shareholder equity
None of these signs automatically proves that the company is financially weak. They indicate that the headline ratios require deeper analysis.
Positive Signs to Look For
Potential signs of higher-quality financial performance include:
- ROE and ROA remaining stable across economic cycles
- Returns improving because of stronger margins or asset turnover
- Moderate leverage
- Consistent operating cash flow
- Growing retained earnings
- Disciplined acquisitions
- Returns that exceed industry averages without excessive debt
- Management allocating capital in a shareholder-friendly manner
- Improving profitability without weakening the balance sheet
The most attractive pattern is often a company producing sustainable returns while preserving enough financial flexibility to survive difficult periods.
Frequently Asked Questions
Is ROE more important than ROA?
Neither ratio is universally more important. ROE focuses on returns generated for shareholders, while ROA measures the productivity of the full asset base. Using both provides a more complete picture.
Can a company have a high ROE and still be financially weak?
Yes. High debt, a small equity balance, accumulated losses or aggressive share buybacks can produce a high or distorted ROE.
Why does debt increase ROE?
Debt allows a company to finance assets without increasing shareholder equity. When borrowed capital produces additional profit, net income can rise relative to a smaller equity base. However, debt also increases financial risk.
Is negative ROE always bad?
Negative ROE usually means the company has a net loss or negative equity. Investors must identify which condition caused the result because the interpretation differs substantially.
Should intangible assets be removed when calculating ROA?
Some analysts calculate return on tangible assets by removing goodwill and certain intangible assets. This can be useful for specific comparisons, but the methodology should be applied consistently across companies.
Does a high ROA mean a stock will rise?
No. ROA measures business efficiency, not future stock performance. Valuation, growth expectations, competitive conditions and investor sentiment also influence returns.
Are ROE and ROA useful for ETFs?
They are primarily company-level ratios. An ETF provider may publish weighted-average profitability characteristics for the companies held by the fund, but investors should not calculate an ETF’s ROE or ROA in the same way they would for an operating company.
Final Takeaway
ROE and ROA help investors understand two different dimensions of financial performance.
ROE shows how effectively a company generates earnings from shareholder equity. ROA shows how efficiently the company uses its total assets.
Neither ratio should be interpreted in isolation.
A high-quality company will ideally produce healthy returns because it has:
- Strong margins
- Efficient operations
- Productive assets
- Sustainable competitive advantages
- Disciplined capital allocation
- Manageable financial leverage
Before investing, examine the trend, compare the company with genuine peers and determine whether improving returns come from better operations or a more aggressive balance sheet.
The goal is not to find the company with the highest ROE. It is to find a company producing durable returns without taking risks that its financial statements may be hiding.
Disclaimer: This article is provided for general educational and informational purposes only. It does not constitute financial, investment, tax, accounting or legal advice, and it is not a recommendation to buy, sell or hold any security. Financial ratios can be calculated differently across companies and data providers. Review official company filings and consider consulting a qualified financial professional before making investment decisions.